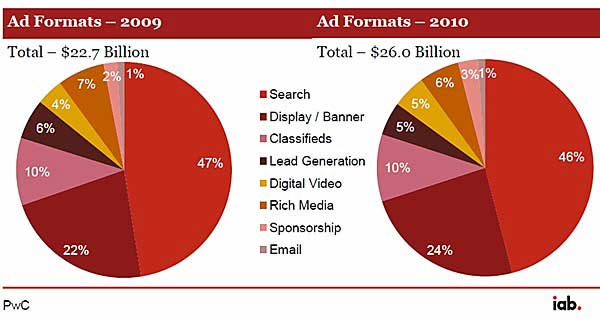
Onlineadvertisingappears to be back on track: US Internet ad revenues reached an all-time high of $26.0 billion in 2010, up 14.9% from $22.7 billion in 2009, fueled by growth in display-related formats,according totheInteractive Advertising Bureau (IAB).
Interactive revenues for the second half of 2010 reached a record $13.9 billion, up 18.3% from $11.8 billion in 2H09.
Below, other findings issued by theIABand prepared byPwC US:
- Searchwas the most popular ad format in 2010, accounting for 46% of total revenues, down 1 percentage point (PP) from 46% in 2009. Search revenues totaled $12.0 billion, up 12.2% from $10.7 billion in 2009.
- Display-related formats—digital video commercials, ad banners and display ads, sponsorships, and rich media—accounted for 38% of the total ad market in 2010, up from 35% in 2009. The category grew 24% year over year (YOY) in 2010, reaching $9.82 billion in annual revenues.
A number of key formats drove display-related ad revenue growth in 2010, including the following:
- Sponsorshipsspending totaled $0.72 billion in 2010 (3% of 2010 revenues), up 87.6% YOY, and up 142% in 4Q10 over 4Q09 levels.
- Display banners adsreached $6.2 billion (24% of revenues), up 23.1% YOY.
- Digital video commercialstotaled $1.4 billion (5% of revenues), up 39.6% YOY.
Among other Internet-ad related findings:
- Classifiedadvertising accounted for 10% of revenues in 2010 ($2.6 billion), up 15% from $2.3 billion in 2009.
- Lead-generationrevenues fell 8%, to $1.3 billion.
- Emailmarketing revenues fell 33%, to $195 million (some 1% of the total ad market).
The IAB also debuted estimates of USmobile adrevenue*, estimated between $550 and $650 million in 2010.
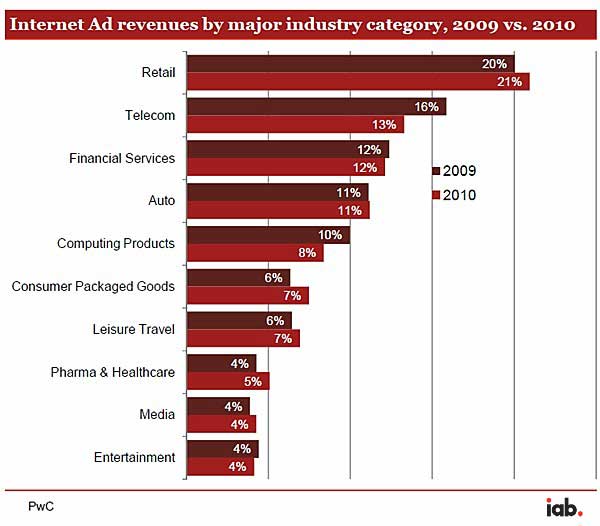
Interactive Spending, by Industry
Much of the interactive growth in 2010 was driven by theretailindustry, which accounted for 21% of ad inventory buying, up from 20% in 2009.Telecom, the second-biggest spender, reduced its share some 3 PPs, from 16% in 2009 to 13% in 2010, while thetechsector reduced its share of spending 2 PPs, from 10% in 2009, to 8% in 2010.
Looking for great digital marketing data?MarketingProfs reviewed hundreds of research sources to create our most recentDigital Marketing Factbook (May 2010), a 296-page compilation of data and 254 charts, covering email marketing,social media, search engine marketing, e-commerce, and mobile marketing. Also check outThe State of Social Media Marketing, a 240-page original research report from MarketingProfs.
Ad Revenues by Pricing Model
Internet ad pricing models continue to shift toward performance: 62% of total ad revenues were priced on a performance basis in 2010, up from 59% in 2009.
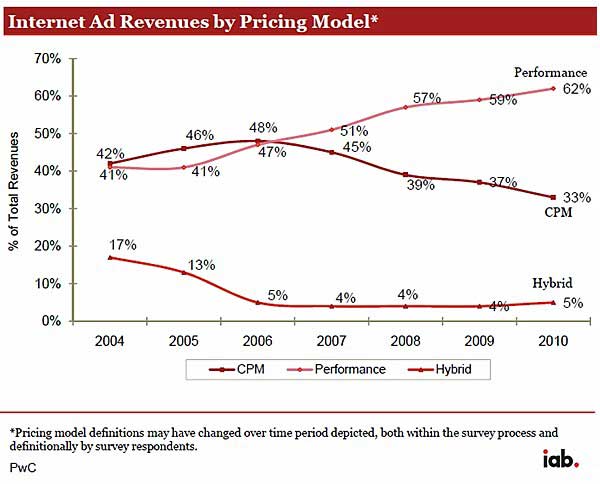
Overall, performance-based pricing, the most prevalent pricing model since 2006, has maintained a strong sequential growth rate over the past four years, while CPM/impression-based pricing has declined.
*Mobile ad revenue is defined as advertising tailored to and delivered through wireless mobile devices such as smartphones, feature phones, and media tablets.
About the data:Findings are from the IAB-sponsored Internet Advertising Revenue Report for 2010, conducted by PricewaterhouseCoopers LLP (PwC)