Google Analytics 4, or GA4, is a fantastic tool for user-behavior analysis.
It can provide all the data you need fortracking user interactions.
But as you gather insights and make improvements to your website, how can you measure success?
You need a set of metrics to track your progress toward your goals, whether sales, marketing, or something else. But with so many potential metrics available, which should you choose?
Here's a list of some of the best GA4 metrics for keeping up with your progress.
Note that we are talking about Google Analytics 4, the latest version of the tool. Some metrics are present in the previous version (Universal Analytics), but many new metrics have been added.
1. Users
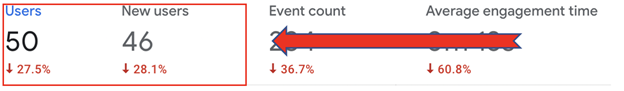
Let's start with a basic but extremely useful metric: the total number of users coming to your website.
It's a crucial piece of information for every online business: As you make site improvements and try to boost your search engine results page (SERP) rankings? Are your efforts paying off with increased visitors?
As well as providing you with the overall number of users coming to your site, GA4 gives you the number ofnewusers, which is crucial for helping you understand whether you're growing your website's reach or you have a bunch of repeat visitors.
The users metric should always be supported by other metrics. For example, it might show you that your user numbers have dropped, but it doesn't help you understandwhythat happened.
2. Engagement Rate
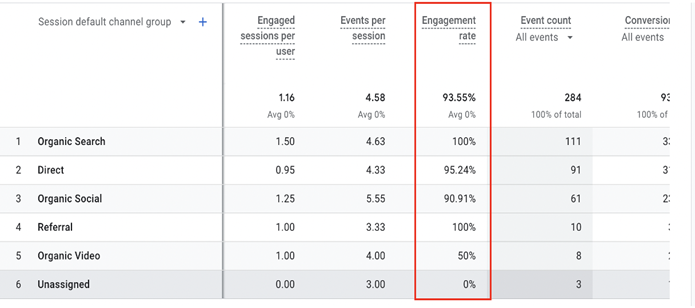
If your total number of usersisdropping, the engagement rate metric might help you find the reason. Engagement rate tells you the percentage of engaged sessions taking place on your site.
An engaged session is defined as any session that...
- Lasted longer than 10 seconds
- Contained a conversion event
- Involved at least two pageviews or screen views
Engagement rate is calculated by dividing the number of engaged sessions by the total number of sessions.
This metric can be useful for various dimensions, such as organic video or email traffic.
Let's go back to the earlier example of a drop in total users. A low engagement rate might indicate thatyour content is not that interestingand so it's not moving visitors to take action. As you tweak content and the engagement rate improves, you might also get a boost in total users.
Hiring a Web developerto make your website user-friendly can positively influence the engagement rate.
If any of that sounds familiar to you, it's because engagement rate is a replacement for an old Universal Analytics feature: bounce rate, which told you the number of users who left your site after viewing only one page.
Of course, that feature had limited usefulness. A high bounce ratemighthave meant that users were not interested in your site. But it could also have meant that they found what they wanted and left.
Engagement rate provides a more in-depth form of user behavior analysis. If users leave quickly but first trigger a conversion event, they're no longer considered disengaged.
3. Event Count
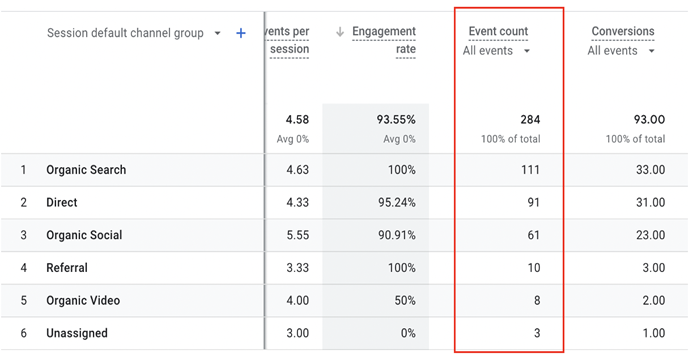
Event count is one of the GA4 metrics to keep an eye on. Every user interaction in GA4 is classified as an event. Event count is a useful way of tracking the events that matter to you.
The metric also gives a stronger insight into user behavior. The most popular events give you a better idea of which aspects of your site users are attracted to. Keeping an eye on this metric is a great way to know where you should be making site improvements.
4. Conversions
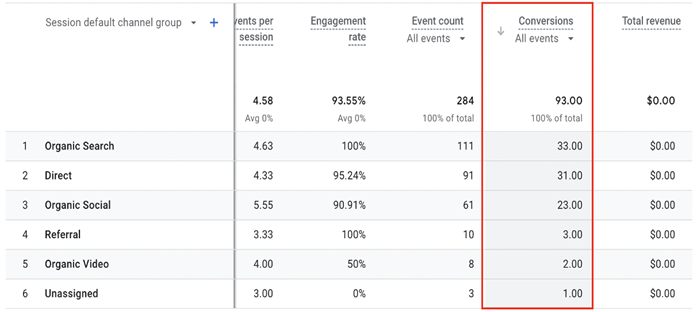
A great thing about GA4 is thatanyevent can be marked as a conversion. Is a certain event critical for meeting your website goals? You can mark it as a conversion so that the event is tracked in your reports.
Let's say you're running a specific product promotion on your website. You can create a "view promotion" event and mark it as a conversion to better track the number of users landing on your promotion page.
If a specific event is receiving a low number of conversions, it's an indication that something isn't working. You can start digging deeper to find the root cause of it and make necessary changes.
Looking at conversions on their own is useful. But for more in-depth user behavior analysis, you should look at the conversion rate. That is the percentage of overall users who converted. It is calculated by dividing the total number of conversions by the total number of users.
For even more in-depth information, look at the session conversion rate. That is the percentage of sessions that contained a conversion event. The session conversion rate is calculated by dividing the number of sessions that contained conversion events by the number of total sessions.
Note: In GA4, asessionis made up of events that occur during a specific time frame.
5. Lifetime Value
Wouldn't it be handy if you could monitor which sources are bringing the most valuable users over a long period of time? Well, thanks to the lifetime value (LTV) metric, you can do just that.
LTV looks at lifetime performance to determine the value of users. You can use that data to allocate your resources more efficiently. For example, you might see that affiliate marketing has a relatively low LTV. Email, on the other hand, might have a much higher LTV.
Without that information, you might waste time and resources on marketing that isn't working.
6. Views
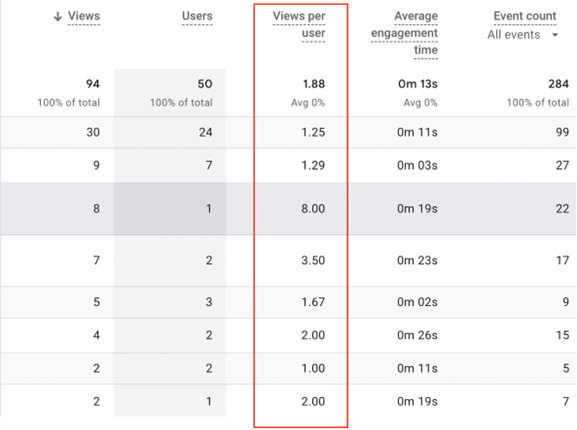
It's easy to get distracted by exciting metrics like LTV and conversion rate, but don't overlook the handy views metric.
View per user helps you to understand how many users have visited a specific webpage. Popular pages on your site can be used as a model for less popular pages.
The metric can come in handy in many ways. You might havelaunched a new product, and you want to monitor the number of users who visit the product page. The views metric can help you to monitor yourSEO efforts. You can see whether specific pages are getting more organic traffic based on the work you did on them and the keywords you're targeting.
Note: Universal Analytics users will again notice a difference here. Pageviews in the previous version of GA referred to views as the number of views attributed to a page. GA4 combines pageviews with screen views into a single metric. That's why, when you switch to GA4, you might notice a sudden increase in views.
If you're looking for "unique page views" in GA4 (the number of unique views of a specific page), there's bad news: Google has, for now, done away with that feature.
7. Average Engagement Time
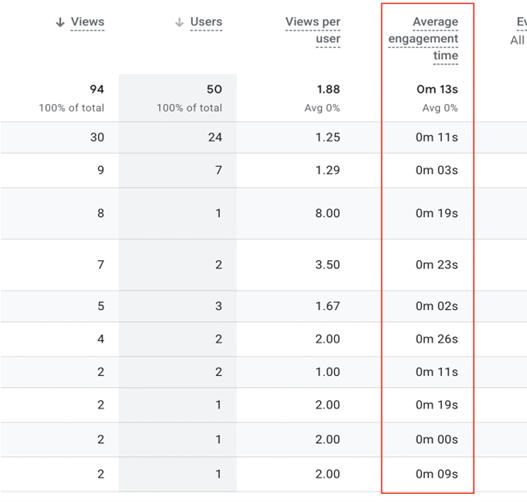
Pageviews can tell you only so much. Lots of users might be visiting a page, but that doesn't mean much if they aren't sticking around or converting. An average engagement time helps you to determine whether users like what they're seeing.
Of course, average engagement time can't tell you exactly what's wrong with a page. You'll need to dig deeper and find out whether the problem is poor content, slow site speed, or some other factor.
Low engagement time isn't always a bad sign. It might be that users get what they need within a few seconds and simply move on without taking any action.
* * *
Understanding GA4 metrics is key to effective user behavior analysis and getting more revenue out of your website. But knowing the best metrics to use can be tough. In this article we've outlined some of the best options to help support your analysis.
If you're new to GA4, why not take time to familiarize yourself with dimensions and metrics? Even if you're familiar with the tool, it might be time to rethink your use of metrics. Think about your goals and the best ways you can measure your progress toward them.
More Resources on Google Analytics 4
MarketingProfs Master Class: Google Analytics 4 for Marketers
Goodbye Universal Analytics, Hello Google Analytics 4
Why Google Analytics 4 Requires Your Immediate Attention: Katie Robbert on Marketing Smarts